Summary: Taking a big problem, question, or analysis and breaking it into chunks frees you from the burden of trying to keep all the plates spinning at once. Compartmentalizing and identifying the dependencies at each step helps you reason out what needs to be done and looked into further.
One of the first problems every analyst has when beginning their career is to do too much at once. You might have heard that a good programmer is a lazy programmer – they spend time automating simple, reoccurring tasks so they can focus on more important aspects. Sometimes it doesn’t always work out so well…
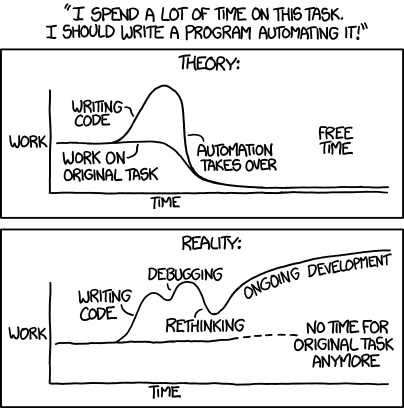
… But it’s generally a good idea!
In training future analysts, they try to answer a question in as few steps as possible. This is great! Efficiency is a noble goal. However, there are three problems.
- You don’t know if you’re pulling what you expect.
- You might need some of that intermediate data down the line.
- You might have missed the subtle details of the question.
The problem is exacerbated when the user is using a GUI rather than writing the SQL or program themselves.
For example in MS Access, you can build a query that mashes six tables with several joins, computes columns, and conditionally counts or sums some field. Inevitably, a manager wants to get the detail on a subset of the data. Now it’s up that same analyst to piece apart their machination. Double that pain when they realize their root data has some issue so the numbers they reported were wrong from the beginning…
This is why thinking like a computer helps you free your mind from the burden of handling the entire problem at once.

IBM punchard from Wikimedia.
Just like the card punch machines from the advent of computing, modern software still executes commands in a sequential order.
- You can’t return the results until you’ve done your calculation.
- You can’t do the calculation until you’ve brought the data together.
- You can’t bring the data together until you’ve identified what source you need.
Each well-thought-out step is a single part of a larger process. Design it well enough and you’ll get (1.) what you’re expecting, (2.) the ability to get intermediate data when needed, and (3) along the way you’ll suss out the nuances of the data / question you’re working with. Let’s walk through a querying and an analysis example.
Keeping your Queries Modular
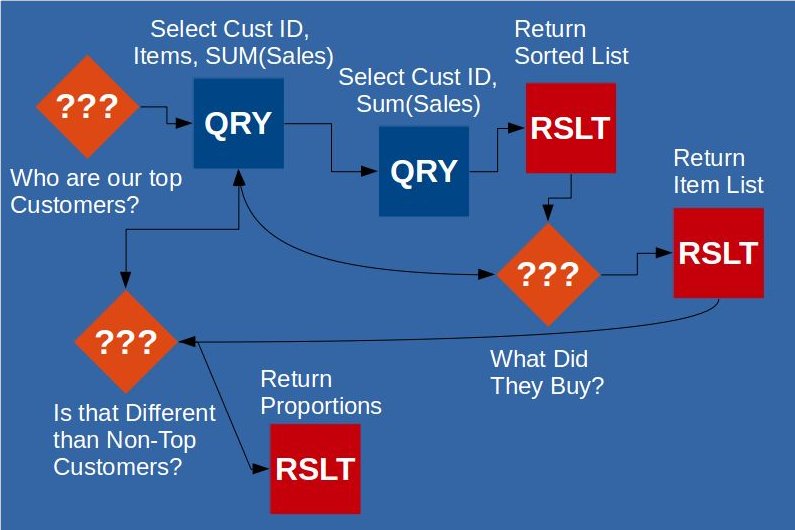
Imagine a situation where your boss asks you “Who are our top customers?” Simple enough. You might just pull the results from your orders table. You might even have a cube / pre-calculated table that has the total sales of each customer rolled-up. Easy!
However, as with every boss, that’s not the end of the question. Instead, when you turn in your list of top customers, they’ll ask “Well, what do they buy?” Here’s where it starts getting sticky.
Let’s say you go back to that pre-calculated table. Now you connect that to some sort of order detail table. Well what happens if a record gets dropped? What happens if the sales don’t add up? Had you started with the order details and done your own calculation, you wouldn’t run into this situation.
I’m not saying you can’t trust pre-aggregated tables. I am saying that you should know what you’re pulling.
Finally, you come back to your boss with the results and, true to form, asks another questions “Well is this any different than the rest of our customer?” Back to the query table one last time… Assuming you designed a set of queries rather than one big massive query, this should be no problem for you to retrieve.
Keeping Analyses Modular
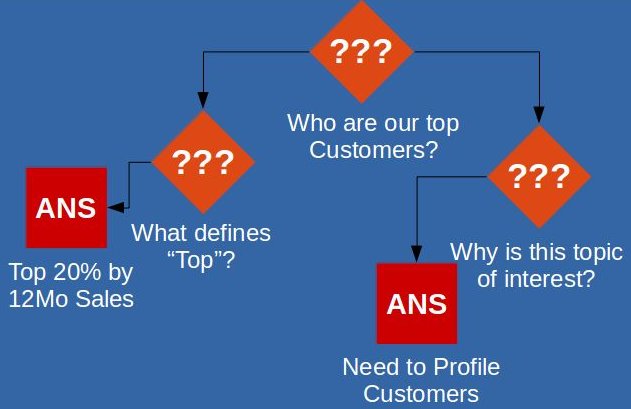
When you’re handed an analysis, big or small, it’s important to break it down into smaller chunks. These smaller chunks let you think more deeply about that particular question. This includes the actual writing of the report / memo but we’ll focus on answering the question for this post. Let’s take the same example as from above: “Who are our top customers?” There are many smaller questions to be answered
- How are the metrics defined?
- Is it top sales? What’s the time period?
- Is it a certain decile of customers?
- Why does my boss want to know this?
- Does he/she want a comparison to some other set of customers?
- Is this a hot topic for management?
- Is this feeding into a hypothesis?
- What should the results look like?
- Is it a printout of customer information?
- Is it an breakdown of products they purchase?
Notice that each question is much easier to answer than the higher-level question above it. Not all of the questions help you identify what data you need to pull, but each one helps you bake-in context to your report.
By breaking up big analyses and queries you effectively make your reports ready to be placed into a computer and analyzed. Each step becomes its own module that can be dissected further or recalled when needed. The simple act of asking questions of your data helps you build better analyses and more elegant (and effective) queries.