Summary: The US Census provides an API that lets you query any of their datasets. Includes population by race, gender, age, and more by zip code, state, congressional district, and a few other geographies.
One R Function to Query All the Census
getCensus <- function(get, for_val, key){
  # API Documentation @
  # http://www.census.gov/prod/cen2010/doc/sf1.pdf
  # Take in selected columns to get (comma delim)
  # and for_val to determine geo
  # Allowed States c(paste("0",c(1:2,4:9),sep=""),
  # 10:13, 15:42,44:51,53:56,72)
  url <- paste("http://api.census.gov/data/2010/sf1?key=",
               key, "&get=", get, "&for=", for_val, sep="")
  print (paste("Accessing...", url))
  out <- readLines(textConnection(getURL(url)))
  #Clean up the data by removing [] and " characters
  clean_out <- gsub(pattern=",$", replacement = "",
                    x = gsub(pattern = '\\[|\\]|\\"|\\\\',"", out))
  header <- unlist(strsplit(clean_out[1],split=","))
  body <- clean_out[2:length(clean_out)]
  body_list <- strsplit(body,split=",")
  body_df <- data.frame(matrix(unlist(body_list),
                               nrow=length(body_list),
                               byrow=TRUE),
                        stringsAsFactors=FALSE)
  names(body_df) <- header
  return(body_df)
}
In my case, I wanted to get the total population by zip code. Using this R function, I called getCensus("P0030001", "zip+code+tabulation+area:*&in=state:01", my_key) and received my data!
Before you start plugging away, you’ll need to do some research and figure out exactly what you’re looking for and how you would get it.
- You’ll need to register for a Census API key (it’s not a fancy site).
- You’ll need to research which variables (and the names of the variables) you’ll want to pull from (list of variables).
- You’ll need to understand which geographies you’ll want. Page 164 lists the codes for each state (caution 730 page PDF).
Selecting Variables
Let’s talk about the variables. A few of the interesting variables include…
[table]
Variable Name,Description
P0120001,Total Population (Gender and Age),
P0120002,Total Males,
P0120026,Total Females,
P0120013,Males between 35 and 39,
P0120037,Females between 35 and 39
P012D009,Males (Asian Alone) Age 21,
P012D042,Females (Asian Alone) between 60 and 61,
P0030001,Total Population (Race),
P0030002,Population: White Alone,
P0030003,Population: Black or African American Alone,
P0030004,Population: American Indian and Alaska Native alone
[/table]
To work with the census API, you need to pass the variables you want with a comma delimitation. Fortunately, this variable name convention lets us take advantage of R’s numeric sequencing to create the variable names with a line of code. This is what I used to select all of the race entries for the Total Population (Race) subset of variables.
paste("P003000",1:8,sep="",collapse = ",")
# [1] "P0030001,P0030002,P0030003,P0030004,
# P0030005,P0030006,P0030007,P0030008"
Working with Geographies
For my use, I wanted to pull in data by zip code. I learned that you can’t just request every zip code at once. Instead, you have to request every zip code by state. The for_val parameter becomes more complicated because it adds an “in” option.
I couldn’t find where all of the geographies were listed so I relied on the set of examples provided.
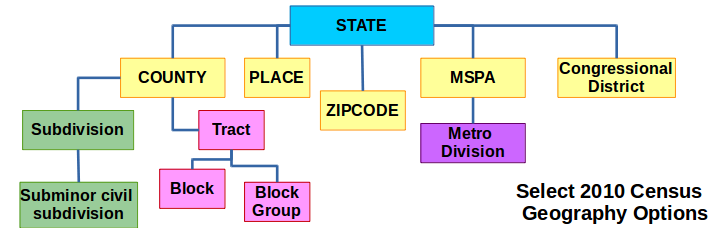
The geographies follow a hierarchy. You can pull state, then metropolitan statistical area or zip code or congressional district or more.
This hierarchy forces you to pick the geo variable that you want to return but then filter it down by using the state (and optionally the other levels of the hierarchy).
However, this doesn’t help you if you want every single zip code for every state. To solve that, I just wrote a for loop that went through every allowed value for state and appended the results to a data frame.
population_df <- getCensus(get=paste("P003000",1:8,
                                     sep="",
                                     collapse = ","),
                           for_val="zip+code+tabulation+area:*&in=state:01",
                           key = my_key)

# States range from "01" to "72" but not a complete range
# Have to build the allowed states
states <- c(paste("0",c(2,4:6,8:9),sep=""),10:13, 15:42, 44:51,53:56,72)
vars <- paste("P003000", 1:8,sep="", collapse = ",")
for(st in states){
  geo <- paste("zip+code+tabulation+area:*&in=state:",st,sep="")
  x <- getCensus(get=vars,for_val=geo, key=my_key)
  population_df <- rbind(population_df, x)
}
You now have a data frame that contains population (in character format) for each race and each zip code.
Notice how I have to initially request the zip codes and I then use an asterisk to select all of them (if I included a single zip code instead, I would get data for that one zip code). I can’t request all zip codes at once so I have to further filter saying “give me all zip codes in a selected state. Hence the need for the for loop and knowing the possible state values.
You’ll need to transform the columns into a numeric before you can aggregate or get proportions.
Backstory
I was working on the Direct Marketing Association’s Analytics Challenge (powered by EY and hosted by the DMA Analytic Community) and we have access to the first three digits of zip codes so I figured I could append some extra information like average population demographics or income.
I tried navigating the American Fact Finder and I couldn’t get a straight download of data by zip code. Fortunately, I found the Census API and wrote this simple to use function.