P-Values and Z-Scores

A P-Value represents the probability that the data you have collected is due to chance.  This helps you determine whether or not there is a real difference between your observations and the norm. The P-Value is calculated by converting your statistic (such as mean / average) into a Z-Score. Z = (X – AVG(X) ) […]
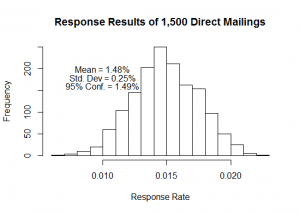
Normal Curve Showing 95% Confidence and Rejection Region

Entity-Relationship-Diagrams

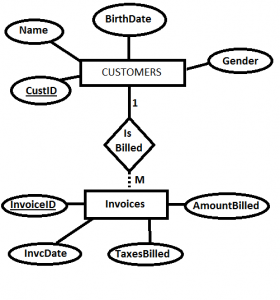
An Entity-Relationship-Diagram (ERD) is a logical model used in early stages of database development.  An Entity is an object that you want to record data about.  You can think of this like your customers, an order or an email campaign.  A relationship is a connection between two entities. Every order has a customer number associated […]


Data Warehouses and Data Marts

In general a data warehouse is a centrally stored source of business analysis data.  It is essentially an aggregated (not necessarily summed or counted) copy of data entered through traditional OLTP systems.  There are two schools of thought on how a Data Warehouse is designed.


Normal Form

In a relational database – i.e. Microsoft Access, SQL Server, DB2, MySQL – the data exist in tables.  In the traditional, academic world, these tables were structured so that they were in “Normal Form”.* In the original paper on relational database design, Egar Codd defines how tables should be created so that it reduces update […]


SQL (Structured Query Language)

SQL (pronounced “sequel”) or Structured Query Language is the pseudo-programming language that defines, retrieves and manipulates data stored in a database.