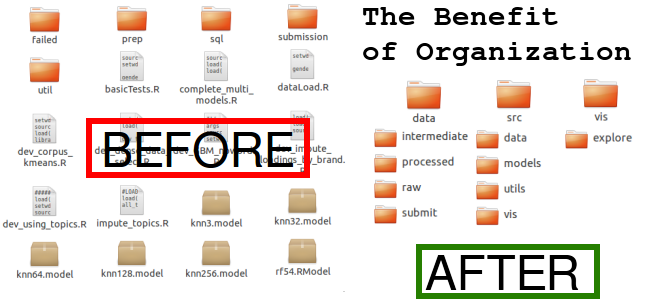
Summary: Keep analyses organized with a directory that supports exploratory and production results (scripts, visualizations, and models) and keep data immutable. Use a tool like CookieCutter Data Science to automatically build a directory structure.
I was recently inspired to look into how others organize their analytical project.s A project at work ended up with an incredibly messy codebase because I didn’t pay much attention to keeping things reproducible. As I go back now to put the model into something of a production standard, I asked myself “How could I have done this better?”
This post on Reddit, my recent foray into trying to win a kaggle competition, continued my interest in keeping code clean. There are many other works published on keep code clean like the Pragmatic Programmer and a great blog post on Nice Code.
In my search, I found a handful of frameworks and concepts that share some common trends.
Using an Existing Framework
If you’re creating analytical project after analytical project, using a pre-built framework can save you a lot of time and you don’t even have to think about what folders to add. They’re just there.
Trends in Frameworks
- Pipelines: Take data in, process it, model it, report on it.
- Exploratory vs Production: Make clear (directory) distinctions between exploratory analysis and production code.
- Processed vs Raw data: Data should never be updated. Instead, processed data should be saved as a separate file in a separate place.
- Figures: Save your exploratory and final plots (in separate places) so that you don’t have to make them again.
- Reporting: Your final output should include some text document that allows for plots and code mixed in with explanations.
General Concepts

CRISP-DM Cycle as illustrated by Kenneth Jensen on Wikipedia
Crisp-DM is a framework designed to be an iterative approach to model development.
- Start with business understanding and domain knowledge.
and domain knowledge. - When you know the problem you’re solving, move toward understanding the data.
- Once you have a grasp of what is available in the data, you can begin to prepare the data for modeling with transformations or feature engineering.
- With the data cleaned and transformed, modeling begins.
- You next evaluate the model and if it meets the business requirements, you deploy the model.
That was the linear version, but in reality each step informs the next and can alter the prior step. If your scripts are scattered or have been modified to the point where the output no longer matches, you’re in for a lot more work.
As part of Johns Hopkins Data science certificate, they explore organizing your analysis with a focus on reproducibility. It’s an 11 minute overview of what your analysis should look like in order to make it reproducible.
Python and R Frameworks
CookieCutter Data Science
The CookieCutter Project Structure is simply a directory structure, a python script to make the structure, and a set of strong opinions on how to organize things.
I like this project because its main goal is to just make things easier rather than force you into one way of thinking.
After installing cookiecutter, you run a single command and you’ll be prompted for some additional information.
cookiecutter https://github.com/drivendata/cookiecutter-data-science
And then you have an organized directory setup that you can start filling up. Even if you don’t choose CookieCutter Data Science, it’s worth considering writing your own project directory script.
[R] Project Template
The R package ProjectTemplate is a complete directory structure and project automation. The automation part makes this a very interesting tool.
- Automatic loading of specified libraries.
- Automatic loading of data.
- Run data munging scripts automatically.
- Store intermediate data with a single command
cache() - Built in support for the
testthatlibrary.
I’m not 100% sure on what size or scope ProjectTemplate is for. Since the main benefit is that it loads and runs a bunch of things for you, I would have to imagine smaller size (i.e. file size) is more appropriate. Maybe for people who routinely revisit an analysis?
But if you’re an R user and you like the directory structure it provides, you’ve got an easy to use tool in your corner.
Notebooks
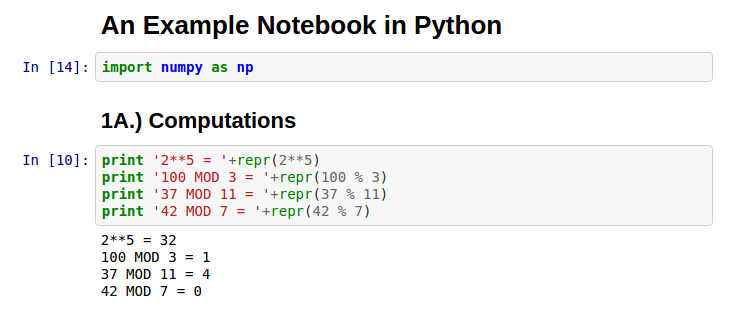
I’m a big fan of using tools like Jupyter, iPython, and Zeppelin for data analysis (R Markdown for R). These notebook tools mix code and results in one easy reproducible html file. How did the analyst get those results? Just look at the code right above the results!
Notebooks allow for self documentation and annotation of tables and charts. I recommend using notebooks as part of a greater productivity toolset for analysts (link).
The biggest drawback, in my opinion, is that a notebook displays everything. For example, you may have a handful of utility functions (like a common string transformation or a performance metric function) that take up a large chunk of your notebook.
If that looks too ugly, you can remove those functions into their own file and reference them in the notebook. But now your notebook doesn’t contain all the code you were working with.
If there were some sort of collapse option for code blocks, you could get away with having the code in one spot but minimized so that the presentation was unimpaired.
On a similar note, notebooks aren’t as easy to collaborate on since it’s mostly one file. If you’re working on a complicated project with multiple team members, using a notebook can quickly go from fun to frustrating.
Recording Experiments
The last area that I still need to better understand is recording experiments.
As you explore different ideas, you can use notebooks but scanning the results of tens to hundreds of different blocks of code can be irksome at best and a waste of time at worst.
Tools like FGLab let you set up different parameters and records the results and compare. It makes me think of the caret package in R (for which there is no current Python equivalent).
I think there is room for innovation in the large-scale (i.e. large number) experiment space. I’m willing to bet there is some scientist who works on high-volume experiments and is hacking away at some tool as you read this.