Bootstrapping

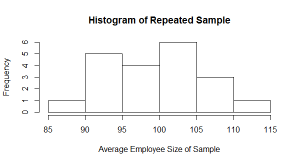
In data mining, bootstrapping is a resampling technique that lets you generate many sample datasets by repeatedly sampling from your existing data. Why Use Bootstrapping: Sometimes you just don’t have enough data!  Statistics requires large amounts of data and repeated samples to be confident in their results.  There are two applications of bootstrapping as far as […]


R-Squared

The R-squared measure is between 0 and 1 where 0 means none of the variance is explained by the predictor variable and 1 means 100% of the variance is explained by the predictor variable.  This is a very handy measure – it distills all the math behind regression in to one number and one that […]


Autocorrelation

Autocorrelation is a way of identifying if a time series data set is correlated with a version of itself set off by a certain number of unit. The equation of the sample autocorrelation function is: The top portion is essentially the covariance between the original data and the k-unit lagged data.  The bottom is sum […]

Formula for AutoCorelation of a sample

Average of repeated samples plotted in histogram

Central Limit Theorem

In a nutshell, the Central Limit Theorem states that the larger the sample size, the more confident we can be in our estimate of the true mean. If you were to take repeated samples from a population (e.g. send out surveys to a random set of your customers multiple times, asking the same questions), average […]


Average, Variance and Standard Deviation

Average (mean or arithmetic mean) is the sum of all values divided by the count of the values. Variance is the sum of the “squared difference between each observation and the average of the observations” divided by the count minus one.  These are measured in square units so variance isn’t easily interpreted. Standard Deviation is […]