Summary: Advanced analyses can be simplified by calling out which variables are most important. Decision Trees, Random Forests, Regression, and Chi-Square tests can quickly reveal what variables carry a lot of weight.
Any analyst can state the obvious or draw spurious conclusions: “Sales increase during Q4”, “Sales drop when we stop advertising”, or “California generates the most sales”. Your manager’s answers will be: Duh, Duh, and doesn’t it have the highest population anyway…
It takes a good analyst to be smarter than the data. There are two ways to look at “important” data.
- What do managers think is important?
- What variables are statistically important?
We’re going to be talking more about the latter and we’ll be exploring three ways of determining statistical importance: Tree based variable importance, Regression and Stepwise Variable Selection, and Chi-Square tests. It’s important to note, that I’m assuming you have some response variable (like sales or buyers of product X or top customers) that you’re trying to optimize for.
For those looking at determining what a managers thinks is important, try building an analytical cheat sheet and a reporting swipe file to help capture and retain those important variables.
Tree Based Variable Importance
A Decision Tree crawls through your data, one variable at a time, and attempts to determine how it can split the data into smaller, more homogeneous buckets. It can be used for either numeric or categorical prediction.
The basic decision trees use Gini Index or Information Gain to help determine which variables are most important. That most important variable is then put at the top of your tree.

However, there are some drawbacks to using a decision tree to help with variable importance.
- Correlation Not Causation: The Gini Index or Information Gain is optimized but that doesn’t imply that it’s the cause of your response variables.
- Choosing Gini or InfoGain: Using the Gini Index or Information Gain metrics can lead to different trees and root nodes.
- Binary Splits: Most software packages are only going to split the data into two buckets at each node. Sometimes your problems won’t be that clean.
- Non-Linear Patterns: Decision Trees are designed to look at linear separations of data, real-world data is often not so simple.
- Biased Results: Your data might be biased – one type of customer is more prevelant than any other. One decision tree isn’t going to be able to get past this bias.
To address the last two, we can turn to another application of decision trees…
Random Forests
Instead of making one model, why not make multiple models?
A Random Forest model combines many decision trees but introduces some randomness into the models built.
- A subset of variables are randomly selected.
- A bootstrap sample is taken which effectively takes about 63.2% of the data into training the model.
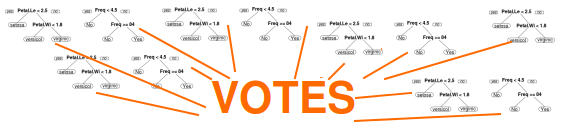
Now each model built is looking at a different subset of the data and isn’t always using the same variables. Now you won’t be second guessing yourself on the importance of your root node. You’ll have hundreds of models to demonstrate the importance of your key variable(s).
In languages like Python and R getting a plot of important variables can be as easy as calling a function on your model.
Regression Based Variable Importance
There are two methods we’ll cover here. Using the coefficients to determine importance and using Stepwise Regression.
Regression Coefficients
Linear regression offers a clear variable importance based on the regression coefficients. Holding all other vales equal, given a one unit change in your variable, the coefficient tells you how much the dependent variable will change.
That’s really handy!
There are a couple facts you need to remember before you start spouting off which variable is most important.
- Bigger Coefficient != Bigger Importance: Your variables might be scaled differently. A binary variable (urban / suburban) is very different than a continuous variable (last home sale price) when predicting a similar continuous variable (future home sale price).
- Hidden Extrapolation: As you’re making inferences from your model’s coefficients, you have to watch out for areas that your model has never seen.
- You’re studying # of campaigns mailed and sales.
- There’s a positive relationship so your suggest doubling the number of campaigns you mail.
- Problem is that the model has never seen data with twice as many campaigns.
- Now you have no idea how your model will perform with the new campaign count.
Hidden extrapolation is solved by knowing the limitations of your data and making smart inferences. To solve the former cause for concern, it’s important to standardize your coefficients in order to compare them.
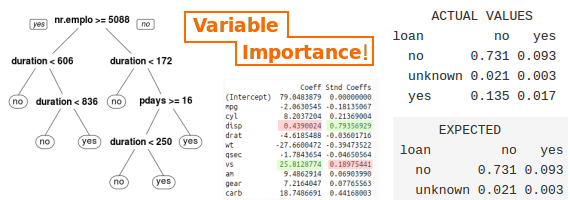
If you’re predicting horsepower in the Motor Trends data set, you’ll see that it looks like the “vs” variable is most important based on the default coefficients generated. But remember the scale of those variables…
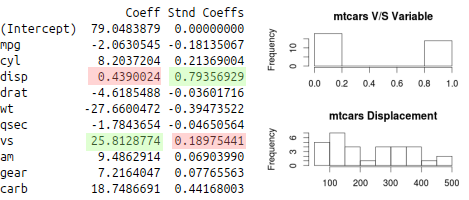
When you standardize the coefficients, you’ll see that disp (Displacement) is the biggest coefficient. A quick google search confirms this relationship.
Forward / Backward / Stepwise Selection Methods
In a similar way to decision trees, regression has a method that helps select which variables should be entered into a model. Stepwise selection methods use a metric called AIC which tries to balance the complexity of the model (# of variables being used) and the fit.
- Forward Selection: Starting with some base model (maybe just the intercept or maybe some variables that must be in the model), you add each variable and see which ones lower AIC the most. With the new model, repeat this process until you no longer improve AIC.
- Backward Elimination: Start with a complete model (potentially all of your predictors) and take each one away one at a time. Choose the model with the lowest AIC and repeat.
- Bidirectional or “both”: Combines both forward and backward elimination. Each step you either add or subtract each variable. Choose the model with the lowest AIC and repeat.
Forward selection is most similar to the decision tree which tries to optimize its splitting criteria by picking one variable at a time.
Visually, the three methods looks a little bit something like this…
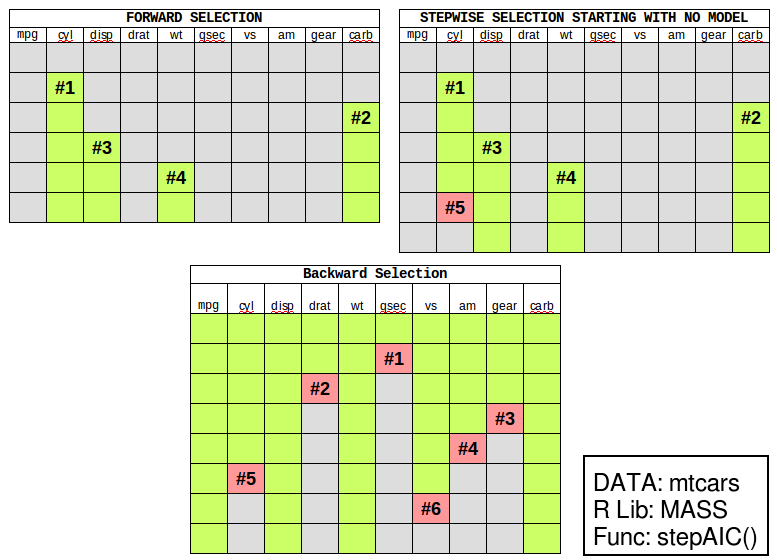
Notice how each method returned a different model? Notice how forward selection picked up the cyl variable first but the stepwise and and backward methods did not include cyl in the final models?
For replication, here’s some messy R code that lets you use the stepAIC function in the MASS package.
#Create a complete model with all variables
mod <- lm(hp~.,data=mt)
#Step Backward and remove one variable at a time
stepAIC(mod,direction = "backward",trace = T)
#Create a model using only the intercept
mod_lower = lm(hp~1,data=mt)
#Step Forward and add one variable at a time
stepAIC(mod_lower,direction = "forward",
        scope=list(upper=upper_form,lower=~1))
#Step Forward or Backward each step starting with a intercept model
stepAIC(mod_lower,direction = "both",
        scope=list(upper=upper_form,lower=~1))
This is an example of how some selection methods can lead you astray. So it’s up to you to be smarter than the data and apply some domain knowledge to your “important model” search if possible.
Full Disclosure: Running this same analysis, a decision tree also chose “cyl” as the root node, but a random forest shows displacement as the top variable.
Chi-Square Tests
In marketing research, you’ll often see reference to a chi-square test for independence. If you have two categorical variables, you can test whether or not they follow an expected pattern. Hubspot actually has a very useful write-up on chi-square test.
It boils down to: Are there disproportionate buckets in your data?
Using the bank marketing dataset, I’m trying to determine if there was a relationship between loans and responding to marketing or what kind of phone contact method they chose and responding to marketing. You do this by comparing the actual results to the expected results based on the probabilities of your data.
By comparing the buckets of the data in the bank marketing data, you can see that one variable has more variance in the data than what we would have expected.
     ACTUAL VALUES  	          EXPECTED
loan         no   yes	     loan         no   yes
  no      0.731 0.093	       no      0.731 0.093
  unknown 0.021 0.003	       unknown 0.021 0.003
  yes     0.135 0.017	       yes     0.135 0.017

#X-squared = 1.094, df = 2, p-value = 0.5787

     ACTUAL VALUES  	          EXPECTED
contact       no   yes	     contact        no   yes
  cellular  0.541 0.094	       cellular  0.563 0.072
  telephone 0.346 0.019	       telephone 0.324 0.041

# X-squared = 862.32, df = 1, p-value < 2.2e-16
In your search for important variables, a chi-square test can be very handy if you’re working with categorical data.
All That Work Just to Hide the Effort
The best analysts do the math but only show the important results. It’s a critical difference between a new and experienced analyst.
It’s completely understandable to want to show off how smart you are to your manager and to the audience of your reports. If you built the most accurate and precise random forest model and proved its superiority over the champion model, you should be proud! That pride has to take a back seat.
Bottom Line: Spend time finding what variables matter in your data but don’t get caught up showing more of your effort than your results.