My friend, Josh Jacquet, and I competed in the DMA’s 2016 Analytics Challenge (powered by EY) and placed 4th out of the 50 entrants. Given that the majority of the other contestants were agencies vying for a little exposure, I think we did well.
To see the detail of our approach, we’ve made it available on github.
In this post, I plan on sharing a brief summary of our approach, some of my personal lessons learned for building models, and some constructive criticism for the DMA / anyone running a data mining competition.
4th Place DMA Challenge Approach
Business Understanding: The challenge itself was to predict profitability of peer-loans. We were measured by our RMSE on a test set.
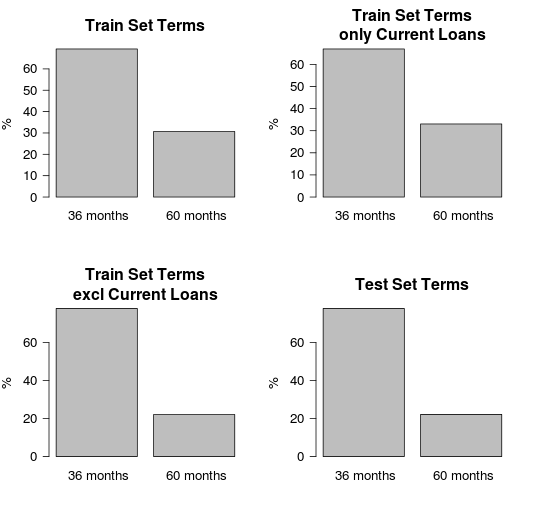
Data Understanding and Data Prep: As seen in the lessons learned, we examined the test data set and tried to create a training set that looked similar to it. We did this by plotting the attributes of the test set.
We made the following data changes.
- Dropped any loan that was still active.
- Removed outliers.
- Transformed freeform text to tokenized binary variables.
- Grabbed external data from Federal Reserve and US Census.
- Including interest rates, mortgage rates, and population by race.
- Engineered a few features that summarized a person’s credit history.
- All numeric variables were scaled with mean of zero. Helps with modeling efforts.
- Profitability was natural log scaled.
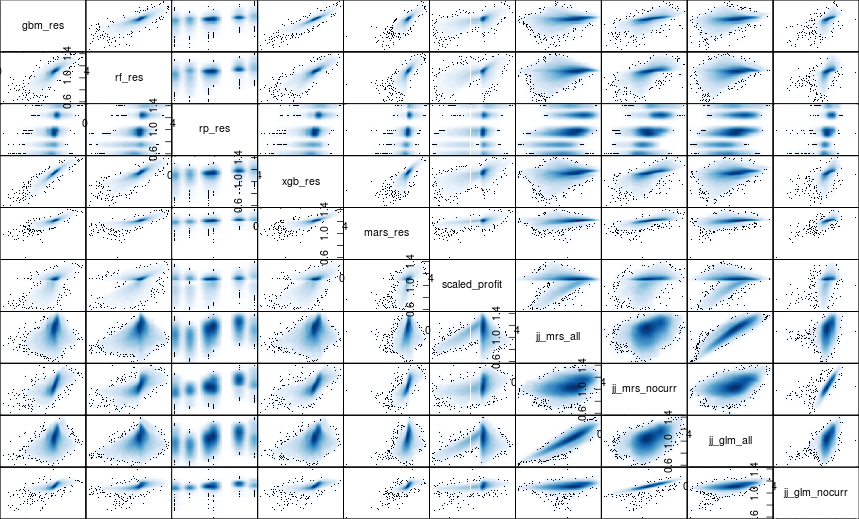
Modeling: We explored quite a few models ranging from linear models (regression, mars) to trees (random forests, gradient boosting, and extreme gradient boosting).
In the end, we used a two layer approach. The first layer contained predictions from a random forest and gradient boosting. These two models were trained on the processed data.
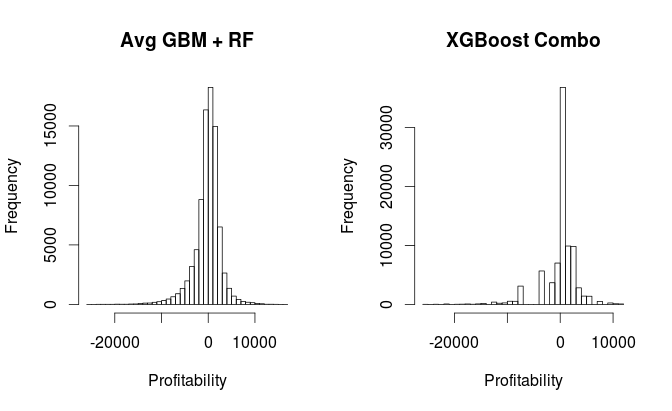
In the second layer, we took an average of the two model outputs as the final result. We tried doing other combinations (XGBoost, Neural Networks, Regression) but those efforts did not generalize well to the holdout sets.
The average RMSE on our holdout set ended up being 0.76597 which scales up to be $4,088 RMSE. Maybe not that bad when the data ranges from -$35,000 to $21,810.
Our test set RMSE ended up being $4,203.9. First place was $3,334.8. Third place was $3,825.3. So we had room for improvement but we had a good showing in the end.
Lessons Learned
Follow CRISP-DM / a Framework: As simple as it sounds, you need to have a process that is iterative. Putting together this analysis was made much easier because we followed an analysis framework. In addition, I think our team would have done even better had we spent more time on feature importance and exploring our datasets.
Winners of Kaggle competitions emphasize feature importance and exploration.
Understand What You’re Testing For: A simple assumption for any analytical challenge is that your training set is similar to your test set and / or future data. However, we realized that a huge chunk of the data was not representative of test set. As a result, we tossed it out since it was just noise.
Building Ensembles of Different Algorithms: Our final model was comprised of gradient boosting and random forests. Ideally, we should have explored the strengths and weaknesses of each type of models. There may have been weaknesses in tree-based models that could have been improved by something else.
Code Sharing: Working in a team was a great exercise since we both came in with different ideas. However, collaborating on code was a challenge. Since it was a competition, we did not use a public GitHub repository and nor did we pay for a private repo.
Since we did not have a common repository, our code base differed. We should have agreed on a style format and a directory structure.
Room for Improvement
We were excited to compete and we’re ecstatic that we placed so highly. However, in the age of Kaggle, we had higher expectations for the administration of the competition.
The timeline was…
- 08/09 – We reach out to the DMA for more info on the challenge. May open up next week.
- 09/09 – I find a cached version of the DMA page that says the competition is open. Going to the live page returns a 404 error.
- 09/14 – Data made available. We have two weeks.
- 09/30 – We submit our final test set submission.
- 10/4 – We find out we’re in the top 5. Told to submit approach detail by 10/6.
- 10/6 – We submit our approach in powerpoint format.
- 10/7 @ 14:16 – We’re told winners won’t be announced until Monday.
- 10/10 @ 18:44 – We’re told we are not #1.
In my personal opinion, it would be better of the DMA to allow Kaggle to administer the future competitions. This would open up the challenge to thousands of analysts.
However, it would seem the DMA challenge is really focused on agencies trying to promote themselves. Since there was no monetary prize, and the final winner “agrees to have a company presenter available at &THEN for the Analytic Challenge session”. Not only that, it seems like they weren’t even paying for the travel or conference registration.
This wouldn’t be feasible for the international competitors on Kaggle.
Bottom Line: We are very happy with our placement and we look forward to competing again next year.